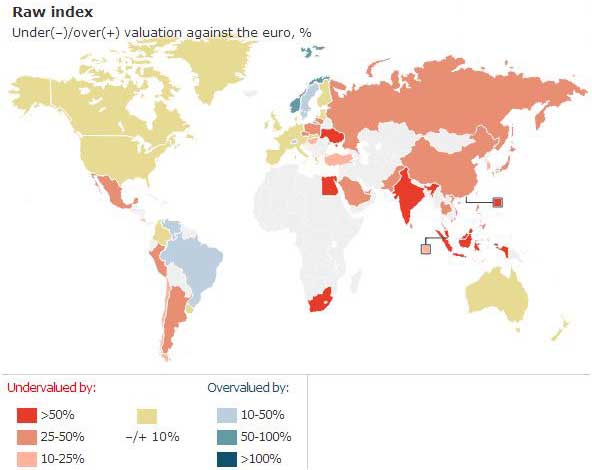
The Big Mac index
The Big Mac Index is a currency index implementing the Purchasing-Power Parity theory (PPP). The Index was originally created in 1986 by ‘The Economist’.
What is the Big Mac Index?
The Big Mac index is a currency index that uses the famous Big-Mac Menu to show if the global currencies are trading at their ‘fair levels’. This funny but economically-logical approach is called as the ‘Burgernomics’ and has been the subject of tens of Academic Studies around the world.
Big Mac index and the PPP Theory
Actually, the Big Mac index is an implementation of the Purchasing-Power Parity theory (PPP). According to the PPP theory, the long run currency rates should fluctuate in a manner that equalizes the price of identical goods and services. In the case of the Big Mac index, the price used is the price of the Big Mac burger.

An Example using the Big Mac index
Let’s say that the price of the Big Mac burger during summer averaged $5.00 in the US and $2.50 in Indonesia. According to the Big Mac index, the Indonesian currency is undervalued by 50%.
Here is the link to the official Big-Mac Index: ► http://www.economist.com/content/big-mac-index
Big Mac Index Comparison Table
This is the comparison table based on the Big Mac Index, as it was published in July 2014 (The Economist).
|
Country |
Local Price |
Dollar Exchange Rate |
Price in Dollars |
Dollar PPP |
Implied Dollar Valuation |
|
Australia |
5.1 |
1.06 |
4.81 |
1.06 |
0.40 |
|
Brazil |
13 |
2.22 |
5.86 |
2.71 |
22.11 |
|
Britain |
2.89 |
0.59 |
4.93 |
0.60 |
2.71 |
|
Canada |
5.64 |
1.07 |
5.25 |
1.18 |
9.51 |
|
China |
16.9 |
6.20 |
2.73 |
3.52 |
-43.14 |
|
Denmark |
28.5 |
5.54 |
5.15 |
5.94 |
7.31 |
|
Euro area |
3.67923829 |
0.74 |
4.95 |
0.77 |
3.31 |
|
Hong Kong |
18.8 |
7.75 |
2.43 |
3.92 |
-49.41 |
|
India |
105 |
60.09 |
1.75 |
21.90 |
-63.56 |
|
Indonesia |
27939 |
11505.00 |
2.43 |
5826.69 |
-49.36 |
|
Israel |
17.5 |
3.41 |
5.13 |
3.65 |
6.91 |
|
Japan |
370 |
101.53 |
3.64 |
77.16 |
-24.00 |
|
Malaysia |
7.63 |
3.17 |
2.41 |
1.59 |
-49.76 |
|
Mexico |
42 |
12.93 |
3.25 |
8.76 |
-32.27 |
|
New Zealand |
5.7 |
1.15 |
4.94 |
1.19 |
3.12 |
|
Norway |
48 |
6.19 |
7.76 |
10.01 |
61.79 |
|
Pakistan |
300 |
98.68 |
3.04 |
62.57 |
-36.60 |
|
Peru |
10 |
2.79 |
3.59 |
2.09 |
-25.20 |
|
Philippines |
160 |
43.21 |
3.70 |
33.37 |
-22.77 |
|
Russia |
89 |
34.84 |
2.55 |
18.56 |
-46.72 |
|
Saudi Arabia |
11 |
3.75 |
2.93 |
2.29 |
-38.83 |
|
Singapore |
4.7 |
1.24 |
3.80 |
0.98 |
-20.82 |
|
South Africa |
24.5 |
10.51 |
2.33 |
5.11 |
-51.41 |
|
South Korea |
4100 |
1023.75 |
4.00 |
855.06 |
-16.48 |
|
Sweden |
40.7 |
6.84 |
5.95 |
8.49 |
24.17 |
|
Switzerland |
6.16 |
0.90 |
6.83 |
1.28 |
42.36 |
|
Taiwan |
79 |
29.98 |
2.63 |
16.48 |
-45.05 |
|
Thailand |
99 |
31.78 |
3.12 |
20.65 |
-35.03 |
|
Turkey |
9.25 |
2.09 |
4.42 |
1.93 |
-7.75 |
|
UAE |
13 |
3.67 |
3.54 |
2.71 |
-26.19 |
|
United States |
4.795 |
1.00 |
4.80 |
1.00 |
0.00 |
|
Austria |
3.39 |
0.74 |
4.56 |
0.71 |
-4.81 |
|
Belgium |
3.7 |
0.74 |
4.98 |
0.77 |
3.89 |
|
France |
3.9 |
0.74 |
5.25 |
0.81 |
9.51 |
|
Germany |
3.67 |
0.74 |
4.94 |
0.77 |
3.05 |
|
Greece |
3.05 |
0.74 |
4.11 |
0.64 |
-14.36 |
|
Ireland |
3.49 |
0.74 |
4.70 |
0.73 |
-2.01 |
|
Italy |
3.85 |
0.74 |
5.18 |
0.80 |
8.10 |
|
Netherlands |
3.45 |
0.74 |
4.64 |
0.72 |
-3.13 |
|
Portugal |
3 |
0.74 |
4.04 |
0.63 |
-15.77 |
|
Spain |
3.65 |
0.74 |
4.91 |
0.76 |
2.49 |
MORE ON CARRYTRADER
| ■ COMPARE PROVIDERS | ► Brokers for Carry Traders | |||||
| ■ FOREX RESOURCES | » Currency indices | » Currency Pairs | » Forex Fundamentals | » Trading Naked Charts & Strategies | ||
| ■ OTHER RESOURCES | » CBOE Indices | » Famous Investors |
■ The Big Mac index
CarryTrader.com


